Coverage Data View
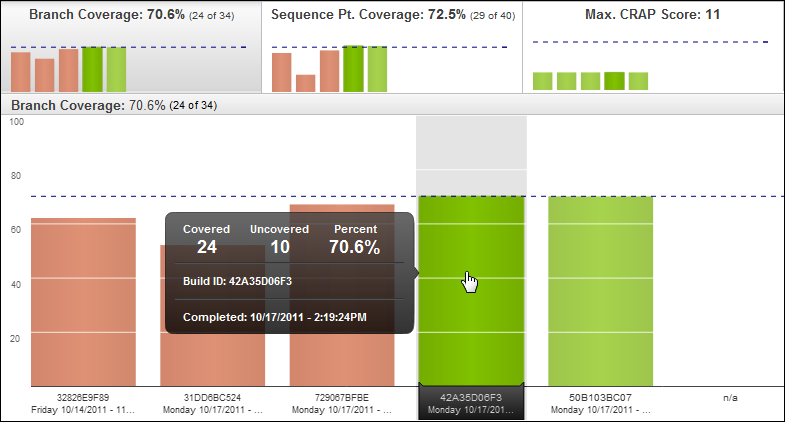
At every level of the Coverage Data View, relevant data points are available when mousing over each bar chart:
Covered - How many of the selected metric, for example, branch points, were covered (that is, tested) in the selected execution.
Uncovered - How many of the selected metric (for example, branch points) were not tested in the selected execution.
Percent - A percentage based on the Covered/Uncovered numbers or the Ratio of coverage (for Satisfactory Complexity).
Build ID - An identifier unique to the project assigned by NCover during profiling.
Completed - A timestamp to indicate when the selected execution finished.
Note that at the Module level  and below on the hierarchy, clicking on a bar causes its corresponding segment in the Statistics view to darken for emphasis.