Please visit Getting Started with Code Coverage for updated information.
Once you are familiar with NCover products, you will soon want to integrate the power of code coverage into your daily builds. Fortunately, NCover has been designed to integrate with your build process and has extensive command line support. Regardless of how sophisticated your build process is, NCover can help. The purpose of this document is to introduce you to the NCover command line tools and walk you through a simple automated code coverage process.
The NCover application suite is made up of three tools all of which are located in your NCover install directory (generally C:\Program Files\NCover). These three tools are:
- NCover.Explorer.exe If you have already installed NCover, then you are probably familiar with this program. NCover.Explorer.exe is a GUI program which allows you to generate and view detailed code coverage information. NCover Explorer includes a visual hierarchy that allows you to drill down to better understand your code coverage metrics at the package, class and method level. NCover.Explorer.exe is great for understanding your code coverage data.
- NCover.Console.exe This program is really the heart of NCover. NCover.Console.exe is the process you use to generate a coverage.xml file that stores the coverage information for a given program. This document will discuss NCover.Console.exe in more detail, but to get a quick sense of the power and flexibility of NCover. Console.exe we encourage you to run it from the command line without any parameters to see the list of supported commands.
- NCover.Reporting.exe The NCover reporting program is new to NCover 3.0 and can be used to generate over 20 reports from your code coverage data. Again, we will be discussing NCover.Reporting.exe in more detail in this document, but to get a quick feel, run the program from the command line without any parameters to see a list of supported commands.
Now that you are familiar with the tools we will be discussing in this document, it is time to take a look at the sample code included with your installation. You can find the program samples under the "Samples" directory in your installation folder (generally C:\Program Files\NCover\Samples). You will notice that NCover ships with four sample applications: A console application, an MS Build application (MSTest), a WPF application and a NUnit application. You can use the sample applications to better understand how NCover will integrate with your specific project. This document will focus on SampleConsoleApplication as this is the most generic.
SampleConsoleApplication is a simple program which allows you to experiment with code coverage. SampleConsoleApplication can take one of four arguments: L, M, H and C which allow you to experiment with Low, Medium, High and Complete levels of code coverage. Notice that executing SampleConsoleApplication from the command line is simplified by several batch files which are included in the samples directory. More information on the batch files and the SampleConsoleApplication can be found in SampleConsoleApplication.doc which is included in the project's install directory.
The first step in integrating code coverage into your build process is to generate a coverage.xml file. To do this with the SampleConsoleApplication: 1. Build the application. This can be done with Visual Studio or by executing the rebuild.cmd batch file. 2. From the command line execute:
ncover.console.exe bin\debug\ConsoleTestApp.exe -h //x output\coverage.xml
This command will execute the SampleConsoleApplication in a high coverage mode and store the code coverage data in output\coverage.xml. You can open the coverage.xml file in NCover.Explorer.exe to get a detailed view of your code coverage results.
At this point, we have automated code coverage. It is easy to run the command above as a batch file after your build completes or as a post build event within Visual Studio.
However, we do not yet have enough information to include code coverage into a build process. Before we can include code coverage in an automated build, we first need to answer two very important questions: What metrics are we interested in monitoring? For each of these metrics, what are the pass criteria?
These two questions highlight one of the key differences between automated tests and automated code coverage. Automated tests fail when any given test within the test-group fails. Code metrics are not so straight-forward. If your code is 99% covered by your test cases, is that enough to pass the build? The answer to this question is dependent on your particular project and will require thought and discussion within your team.
NCover supports monitoring the following code metrics from within your build process: SymbolCoverage, BranchCoverage, MethodCoverage and CyclomaticComplexity. The four coverage types are different ways of calculating code coverage. For a description of these types, please see Code Quality Metrics.
Cyclomatic Complexity is an industry standard measure of code complexity. You should consider monitoring cyclomatic complexity when you are concerned about code maintainability or testability. High cyclomatic complexity can also be used to highlight areas of your code which may need refactoring.
Once you have decided the metrics you are interested in monitoring, you can use the NCover.Reporting application to track those metrics as part of your build process. As an example, run the following command against the high coverage.xml file we generated earlier:
ncover.reporting output\coverage.xml //mc SymbolCoverage:80 //mc CyclomaticComplexity:75
You should see output similar to:
The following elements failed to meet minimum coverage requirements:
coverage.xml (Symbol: 73.33% Minimum: 80.00%)
1 items failed the minimum coverage rules.
Execution Time: 383 ms
Here, our code coverage failed. We specified a minimum SymbolCoverage of 80%, but achieved only 73.33% coverage with our tests. You can change the command line arguments to achieve the results you are interested in. The test program will fail if the CyclomaticComplexity metric is set to 5 or less. Of course, we can also use the NCover.Reporting tool to actually generate reports. For example, if you run the command:
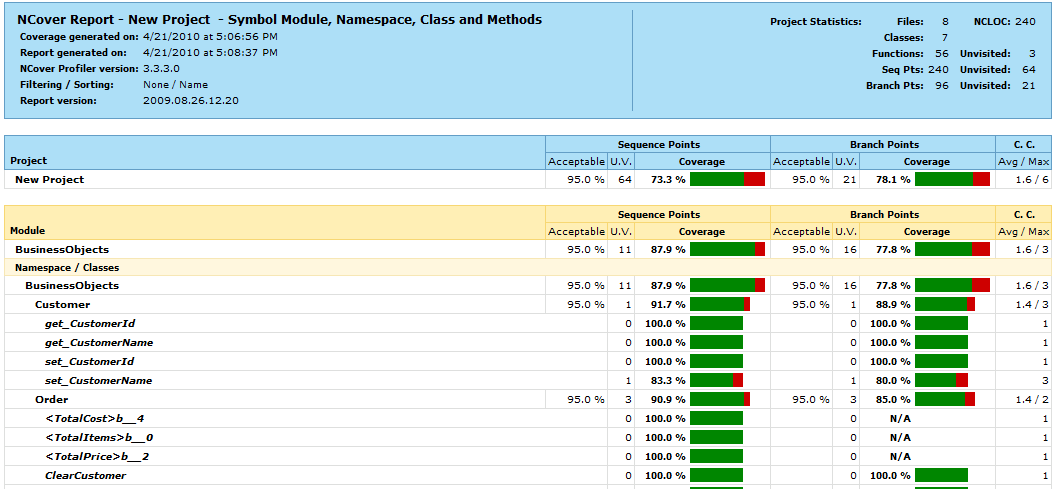
ncover.reporting output\coverage.xml //or SymbolModuleNamespaceClassMethod:Html:output
An HTML report will be generated for you that will look like below:
Finally, in addition to the output displayed and generated by NCover.Reporting, the program will also return an exit code which can be used to determine if the execution was successful based on the metrics being monitored. NCover.Reporting supports the following exit codes: * 0 - OK. The program executed without incident. * 2 - Exception. The program failed to execute. The failure was not related to the metrics being monitored. * 3 - Metric failure. One or more of the metrics being monitored did not meet the minimum criteria specified. Using this information we can easily integrate with the reporting tool to check for metric errors and take action as appropriate. For example, in C# we could monitor the NCover.Reporting application with:
Process process = System.Diagnostics.Process.Start("ncover.reporting.exe",
    @"""C:\Program Files\NCover\Samples\SampleConsoleApplication\output\coverage.xml"" //mc SymbolCoverage:80");
process.Start();
process.WaitForExit();
if (process.ExitCode == 3)
{
    Console.WriteLine("Build failed due to insufficient code coverage.");
}
Conclusion
NCover provides a very powerful and flexible tool set which can integrate into your build process and help you deliver higher quality code. The flexibility provided by the NCover tools may seem a little intimidating at first, but with a little experimentation it is easy integrate NCover with any build process.