NCover Explorer makes a plethora of code coverage metrics easily accessible to any developer. In this how-to guide you'll learn how to access those metrics within the NCover Explorer interface.
Getting To Know The NCover Explorer Interface
NCover Explorer was designed to optimize a developer's efficiency for finding uncovered blocks of code.
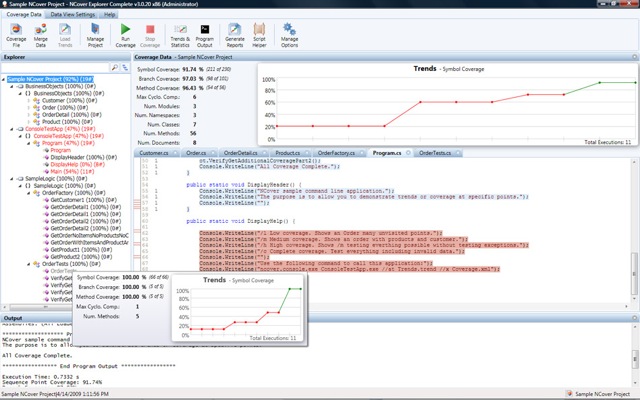
- The Tree View allows users to browse their code's object hierarchy and search for particular items in the hierarchy.
- The Statistics Panel presents detailed statistics on the currently selected item in the Tree View, and trends for that item.
- The Source Code View highlights uncovered segments of code within your source, and provides the ability to quickly navigate to uncovered blocks within a document.
- The Output Panel presents the output of NCover when it is run from within NCover Explorer.
The Tree View
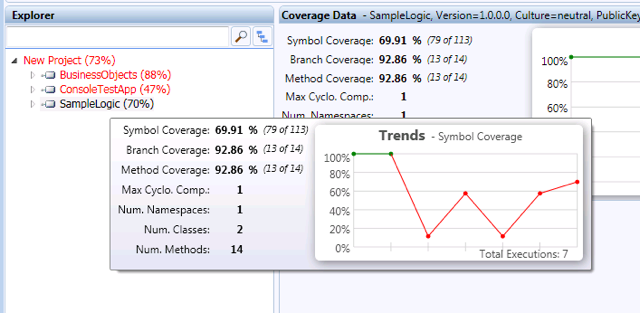
The Tree View gives you a high level view of your code's structure and the coverage percentages of your assemblies, namespaces, classes, and methods. Hovering over any element in the tree view displays a statistics box with details on that particular element, such as the different coverage metrics available, method counts and lines of code. The statistics box also displays the trends for that particular element, if trend data is available.
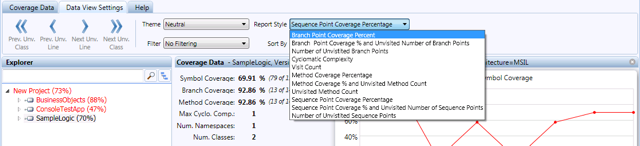
Each element in the tree view displays a coverage statistic next to it. By default, this is the sequence point coverage for that element. The statistic used can be changed by choosing the Data View Settings tab in the toolbar and choosing a different report style. Changing the report style will also change the statistic used for any trends graphs displayed in NCover Explorer. On the Data View Settings tab of the toolbar you can also change your sorting and filtering preferences for the tree view.
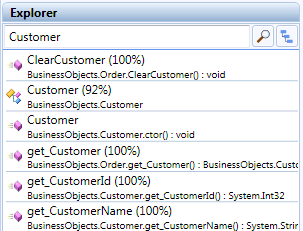
By entering a search term in the top of the tree view and clicking the search button you can see matches to the term entered.
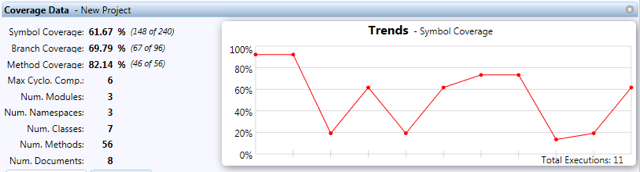
The Statistics Panel
Clicking on an element in the Tree View will display its statistics in the Statistics Panel. The panel shows statistics similar to those shown in the tree view statistics box, but in a larger format.
The Source Pane
If you're using NCover Explorer you probably want to find uncovered code to target with tests. The source pane highlights individual lines of source code that are uncovered and that need to be tested. To view a source file, simply click on a class or method in the Tree View. The source pane displays your source code with covered and uncovered segments of code highlighted. Each line of code also displays a visit count on the far left.
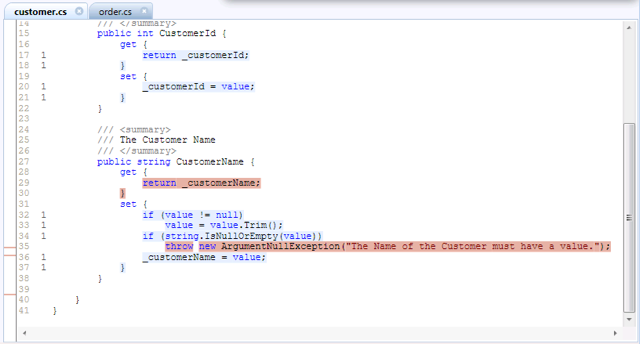
The Source View also includes the Uncovered Code Navigator on the far left. The Uncovered Code Navigator is a high level view of your file that displays red bars for lines that are uncovered. Clicking on a red bar in the Uncovered Code Navigator navigates to that line in your source file. You can also navigate to next and previous uncovered segments of code with the Previous and Next Uncovered Class and Line buttons on the Data View Settings tab in the toolbar.
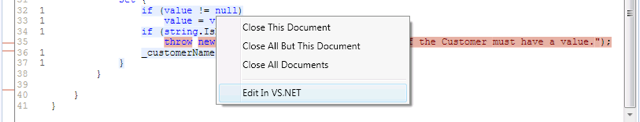
When viewing a file in the Source View, you may want to open it in Visual Studio. Simply right click on the source view and choose Edit in VS.NET and your file will open in Visual Studio.
Further Reading
You may want to learn more about several of the topics pointed out in the NCover Explorer Interface