Please visit Getting Started with Basic Coverage for updated information.
This article will tell you more about NCover, the premier code coverage tool for the .NET framework. Since its creation 4 years ago, NCover has been used worldwide by over 100,000 developers.
Code quality is one of those timeless topics that developers and software architects have struggled with for decades. The accepted wisdom is that the earlier a software defect is found, the cheaper it is to fix.
Most software development methodologies focus on finding defects as early as possible in the development cycle. Agile development is a great approach for increasing software quality. One of the core tenets of agile development is building a library of automated tests that the code must pass every time it changes. This approach has been used by development teams for years. It has proven to be effective at improving quality while working for both small and large teams.
Let's assume you're using agile methodologies and that you've written an automated set of tests. Once you start to analyze the results, an obvious set of questions comes to mind:
- What portions of my code have not been tested?
- How can I decrease the amount of untested code?
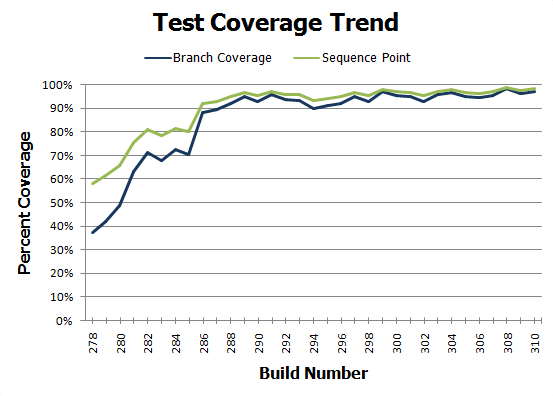
- Is my code becoming more or less tested over time?
For a software development team, answering these questions can mean the difference between a high-quality project and a disaster. NCover answers these questions.
Code Coverage Analysis, applied while running unit tests over your code, shows the developer which portions of his or her code were exercised during the test and gives a concrete measurement of unit test penetration. By tracking these statistics over time, you gain a concrete measurement of code quality during the development cycle.
What is Code Coverage?
Code coverage analysis is a measurement of how much of a running program's code was executed. Specifically, code coverage usually shows how many times each line of code was executed. There are actually many forms of coverage metrics, such as function coverage, statement coverage, branch coverage, exit point coverage, and conditional coverage. NCover focuses primarily on Symbol coverage (which is a special form of statement coverage) and branch coverage.
NCover's definition of coverage is as follows:
- Symbol Coverage - Symbol coverage looks at the number of points within the program where the debugger can pause execution. Usually this corresponds to a line of code, however some compilers allow you to pause at several places within an expression, so the Symbols could be slightly higher than the number of lines or statements.
- Branch Coverage - Branch coverage looks at the execution path of a method and determines the number of places where the code can make a decision to "branch" off. This corresponds to statements like if, while, for, foreach, switch, etc... The branch points are used to segment a method into contiguous blocks of code. Those code blocks are then used to calculate coverage.
So, why would you use the two forms of coverage?
Branch coverage is a more accurate measure of coverage because it compensates for method complexity. Since branch coverage is generated from the underlying opcodes, it often does not map cleanly to source code. That means it's difficult to take branch coverage reports and determine how to write tests that will improve coverage. On the other hand, since Symbols directly reference debug symbols, it's easy to relate Symbols to source code. The bottom line is:
- Use branch coverage as your measure of quality, but
- Use Symbol coverage to determine which code statements need more testing.
When Should you Use Code Coverage?
Early and often is the short answer. The heart of an iterative development environment is a continuous integration server. Each time a developer checks code into the revision control system (or on a regularly scheduled cycle), the build server should check out the latest code, do a full build of the product, run the test suite and report test success/failure and code coverage metrics. If you aren't already using a continuous build server, CruiseControl.NET by ThoughtWorks is a terrific (and free) option. A continuous build process facilitates the early detection of code errors and immediate reporting of code coverage also makes it clear to everyone on the team if the quality of the tests are increasing or declining.
How do I Implement Code Coverage?
NCover performs analysis on code by instrumenting it behind the scenes while the tests are running. If using NUnit as the unit testing tool, simply prefix the NUnit command line with the NCover command.
NUnit command line:
nunit-console MyTests.dll
NUnit with NCover:
NCover.Console nunit-console MyTests.dll
It's easy enough to create code coverage data, but analysis is where you actually begin to improve your tests. We include NCoverExplorer with NCover for this purpose. NCoverExplorer highlights those lines of your code that are uncovered, and does statistical analysis of your coverage data as well. It can even run a program and collect coverage data for you, so many developers never touch the command line version of NCover. NCover also includes an HTML reporting feature for teams that want to generate analysis reports including highlighted code directly from their continuous integration server