Covering IIS
NCover 4 runs as a service, so it's already monitoring, ready to cover any .NET code executing on your machine.
This ability to gather data globally is key to understanding how to leverage the power of NCover 4. When setting up any project the first question you should ask is, What process do I want to cover? If NCover 4 can find the executable or service that's exercising your code, it can collect coverage data.
The VS 2010 plug-in can display any previously generated coverage information from NCover 4, but let's create a new project and see how NCover 4 integrates with Visual Studio.
Creating a Project
From the Home view of the NCover 4 Explorer, click Add New to open the "Create a New Project" window.
Match Rules
When the "Processes" tab displays, name your project and then select one of two methods to specify the processes to be covered.
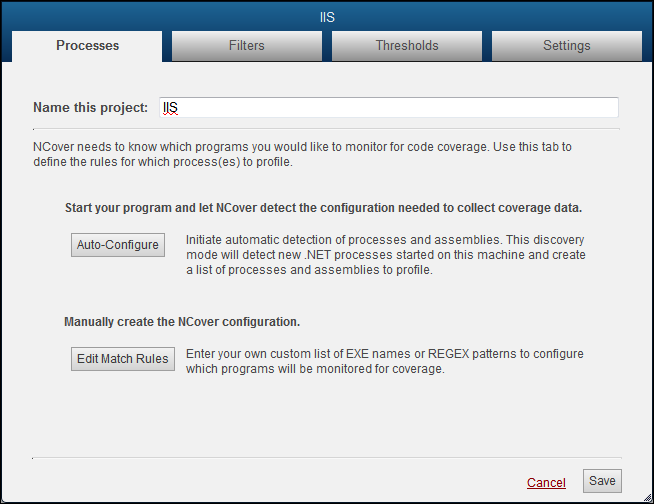
Note: If you're setting up coverage for a process running locally on the machine where Desktop is installed, you can let Auto-Configure create project settings for you (see step 3 below).
You can also set up match rules manually, if you prefer.
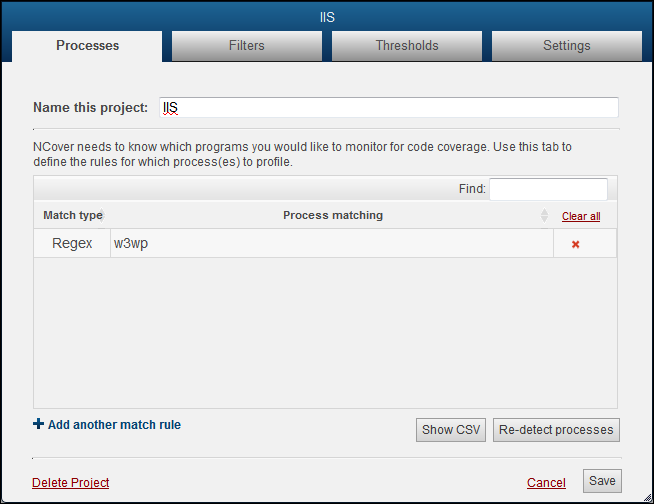
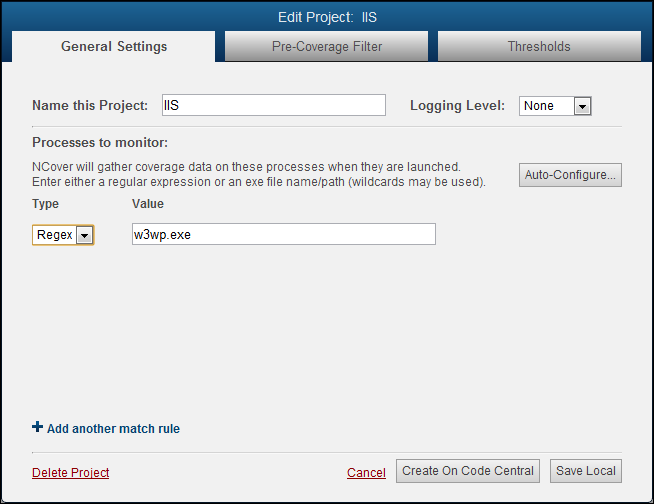
The two match type options are Regex and Exe.
A regex is a good way to catch the worker process whenever it runs locally. For example, "w3wp".
You can use the Exe option to make sure that an executable is only profiled when this particular exe runs from this specific location -- from a debug folder, instead of a release folder, for example -- by using the full path to the executable.
Auto-Configure
Another option is to click on the Auto-Configure button and let NCover create match rules for you.
The Processes tab will switch to the Auto-Detection view and start monitoring for .NET processes as soon as you click on Auto-Configure.
Note: Reset IIS so that the NCover profiler can attach to the w3wp process.
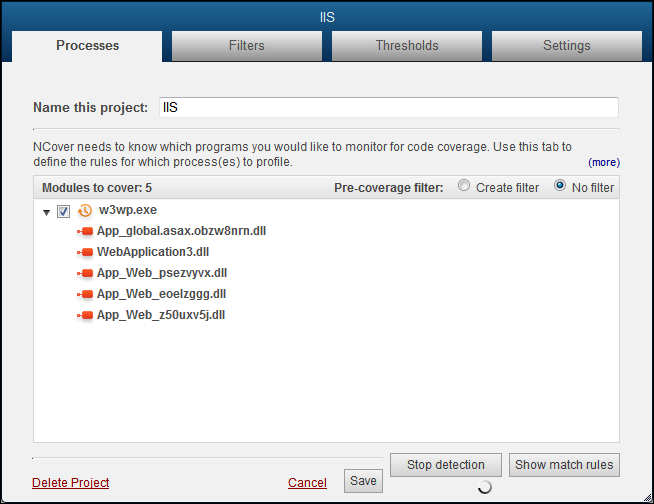
Start your web application, and the executables and assemblies that are being loaded will display in the detection window.
Note: All modules are automatically included when the default "No filter" option is selected.
Switch the Pre-Coverage filter radio button to "Create filter" to review the "Modules to cover" and decide whether to include or exclude modules from the list.
Click the checkbox beside each module once to mark with an X to exclude the module. Click twice to mark with a check to include the module.
Note: You can specifically exclude modules by placing an X beside them on this screen, but any modules that are not specifically included will not be profiled, anyway. In other words, not creating an include is functionally the same as creating an exclude rule.
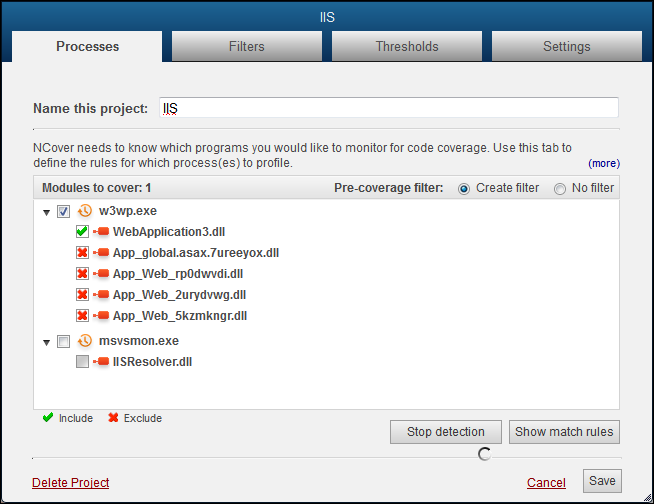
The selections shown above create the filter rules seen below when you click on the Filters tab.
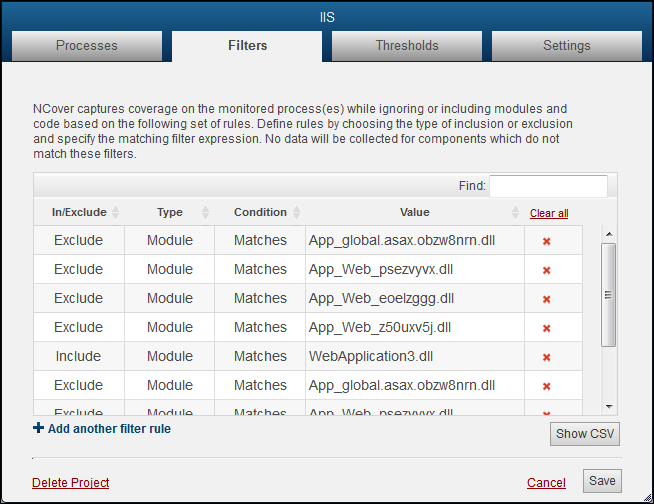
Click on the "Processes" tab to see what match rules have been created.

Auto-configure has created an Exe match rule, which tells the NCover profiler to match on the executable name.
Click Re-detect processes, if necessary, to re-capture your processes/assemblies.
Collecting Coverage
When your project selections are complete, start or re-start IIS and run your manual or automated tests.
If you're viewing the Home page of the NCover Explorer from the NCover > View > Explorer View, you'll also see that the light beside your enabled project is pulsing green to indicate coverage is being collected.

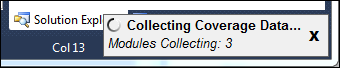
In the lower right corner of the Visual Studio window, you'll see a pop-up when you're gathering coverage. The Modules Collecting counter displays the number of modules being profiled in the current execution of your project. The number will fluctuate while coverage is running, but the counter should eventually disappear when profiling is complete.
When your tests are complete, don't forget to stop or cycle IIS to end profiling and allow NCover 4 to collect coverage data.
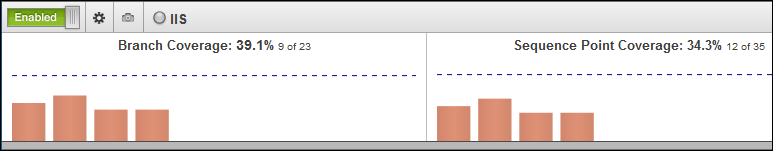
The Visual Studio plug-in makes the process of collecting code coverage simple, and then gives you access to dynamic and powerful views of coverage trends.