How Do I View the Coverage Data?
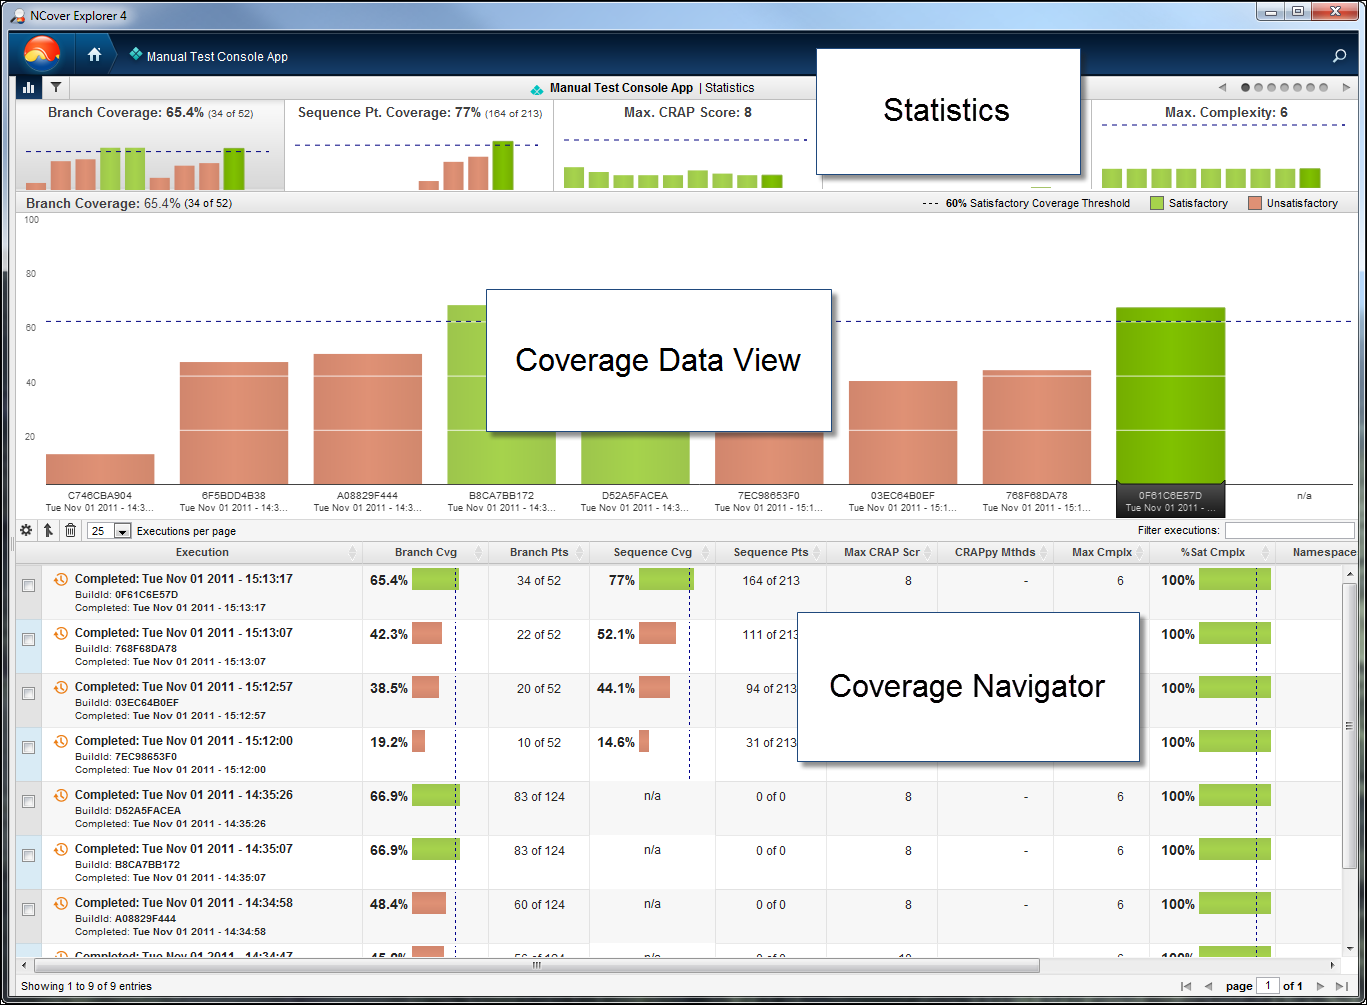
The Data Coverage View changes dynamically to display the data that's relevant to the level of code you're viewing. The Home view summarizes all your projects, and the Coverage Data view changes as you drill-down to display statistics at each of six data levels: Execution, Module/Document, Namespace, Assembly, Method, and Source Code.
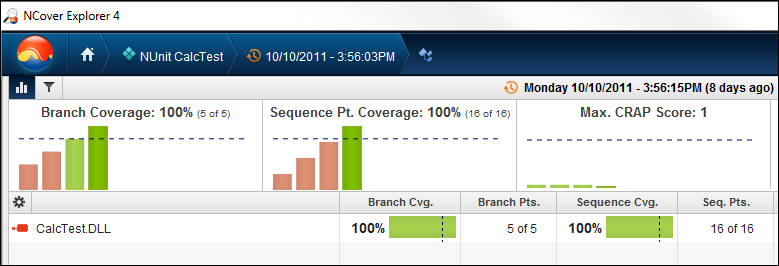
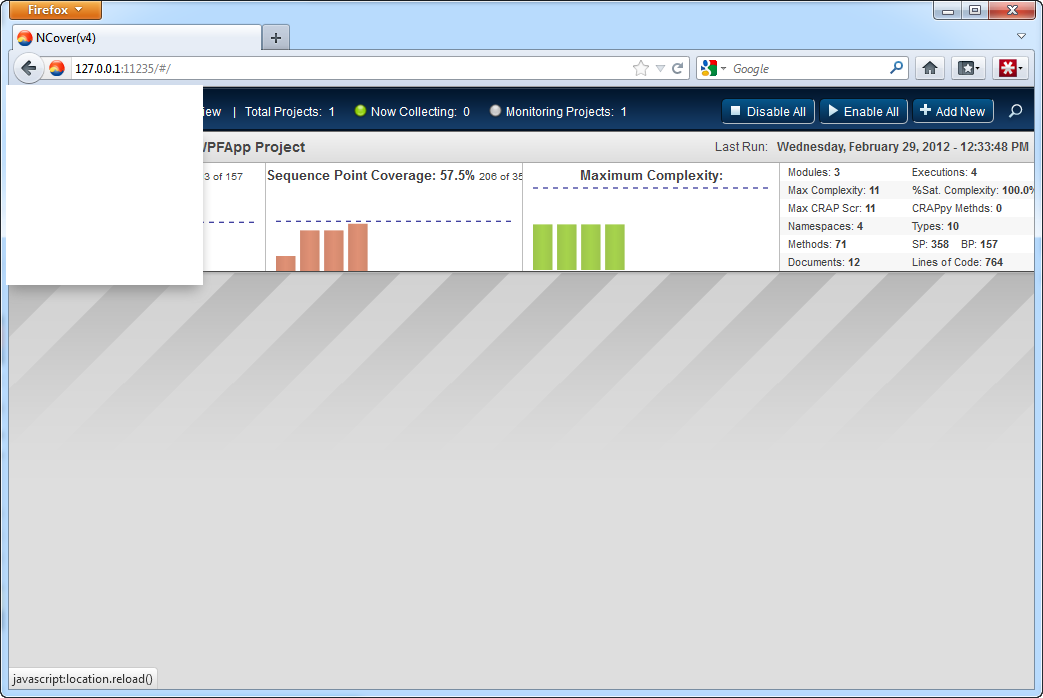
Once a coverage execution is complete, clicking on the name of your project from the Home page will change to the Project View, with a slider-driven list of Statistics at the top, the Branch Coverage or last selected report in the Coverage Data View, and a list of completed Executions, their logs, and statistical summaries at the bottom, in the Coverage Navigator pane.
NCover Explorer is included with your install in cases where an HTML 5-compatible browser isn't available or preferred, but the NCover browser is the preferred platform for using the coverage tools.
The NCover browser also allows you to bookmark your favorite coverage views for easy access, a feature not available in NCover Explorer.
Navigation
The 'breadcrumb' hierarchy at the top of NCover Desktop shows where you are in the coverage data -- by Project, Execution, Module/Document, Namespace, and Method -- and allows you to easily move back up as many levels as you like.

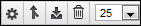
The Coverage Navigator defaults to displaying 10 executions per page, but the drop-down in the Navigator header are allows you to choose as many as 500.
At data levels below the execution, the Coverage Navigator also defaults to displaying 25 nodes per page, but the drop-down allows you to choose up to 500.
Note: The executions page in Desktop will allow you to browse all your executions, but only the most recent 20 are used for trending (that is, will appear in the Coverage Navigator charts).
The Search executions field allows you to further refine your view by searching on specific criteria like name, build ID, day or date.
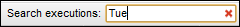
Once a filter is applied, a dialog box in the lower left corner of Explorer shows you how many entries are being displayed by the filter in relation to the (unfiltered) total number of executions.

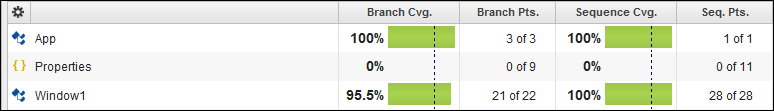
In the bottom panel, the Coverage Navigator also shows you what level of coverage you're viewing, along with what specific Modules, Documents, Namespaces, Assemblies or Methods are currently loaded Besides your location, the Navigator also displays a customizable summary of all available code coverage metrics on each line.
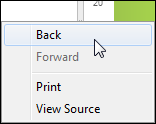
You can go Back or Forward to previously viewed pages by right-clicking anywhere in the Explorer window.
You can bookmark a page in NCover browser just as you would any web page to povide quick access to a set of favorite coverage views.
Note: Since Desktop runs as a local service, any bookmarked pages are available only on the local host (http://127.0.0.1:11235)
Column Display
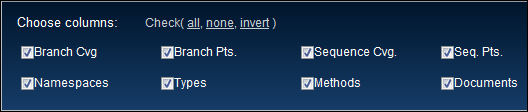
You can choose which code coverage columns are displayed in the Coverage Navigator by clicking  in the upper-left corner of the panel. The selections you make here are applied globally, but can be modified at any time, from any level of data.
Drilling Through Data
After selecting a Project on the Home page, click on an Execution to drill down to the next view, which defaults to Modules, with Documents also available.
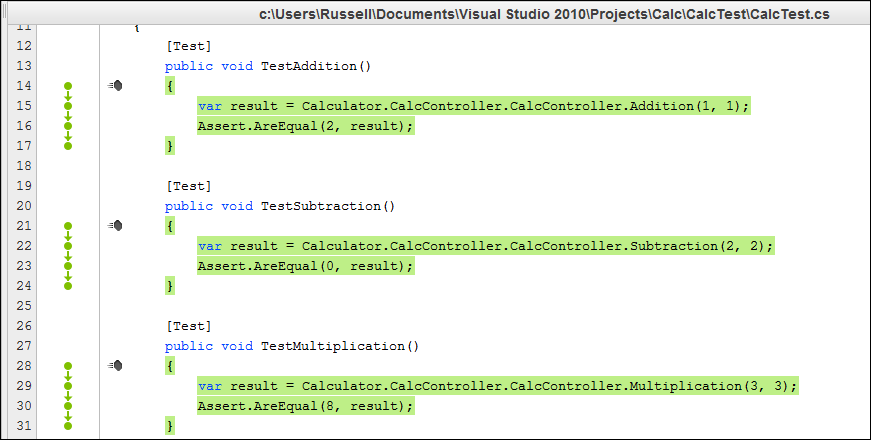
Click on a Module to continue drilling through Namespace, Assembly, and Method to arrive at the Source Code view. If the source code you profiled was compiled locally, the source document and lines of code will be displayed. If the source code was compiled on another machine and copied locally, a message that "The source code is not available" will be displayed.
In the lower right corner of the Source Code window, the coverage status is indicated by simple red or green text coloring of the word 'Covered' in a pop-up window, activated by mousing over lines of code.
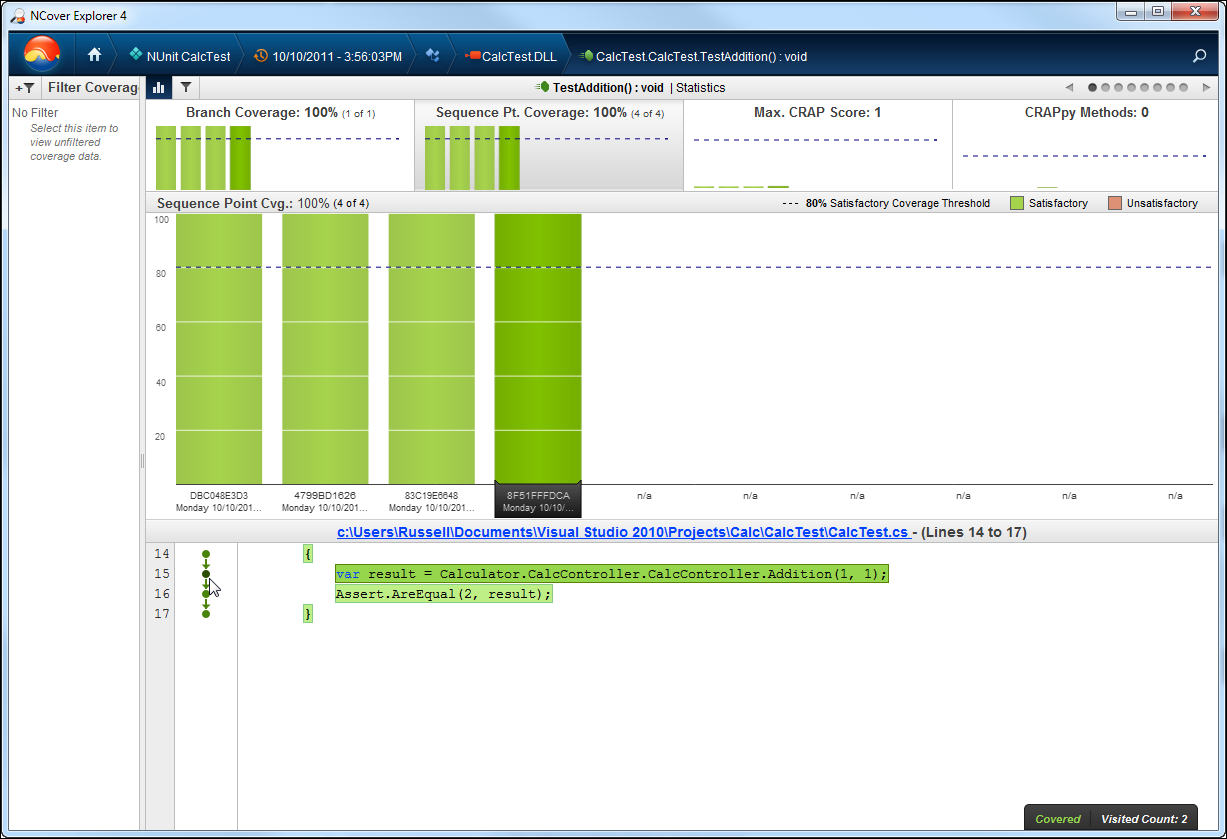
The number of Visit Counts is also displayed in this pop-up when hovering.
Branch Visualization, a graphical display of the possible paths through the highlighted code, is displayed to the left of the source code, and coverage highlighting appears on the code itself. The branch visualization is dynamic, changing to display the code paths your cursor is currently over.
If the source code you profiled was compiled locally, clicking on the document link in the Source Code View will display the entire document, rather than the lines of code contained in the method you drilled-down on. If the source code was compiled on another machine, a message that "The source code is not available" will be displayed.
You can refresh your coverage data anytime from the drop-down menu below the NCover icon on the Home view.
NCover will also alert you with a toast pop-up notification at the top of the Explorer window when new coverage data is available. After you click on the notification, the window will refresh, and the latest execution data for the level you're viewing will be displayed.

Viewing Statistics
At the Project View and below, the Statistics view in the top panel of the Explorer window displays data relevant to the selected Execution.
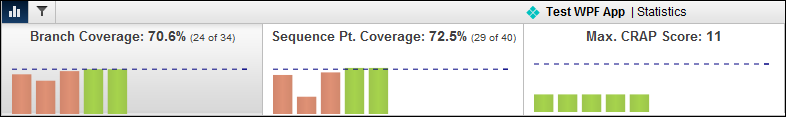
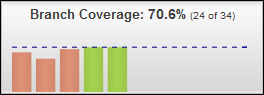
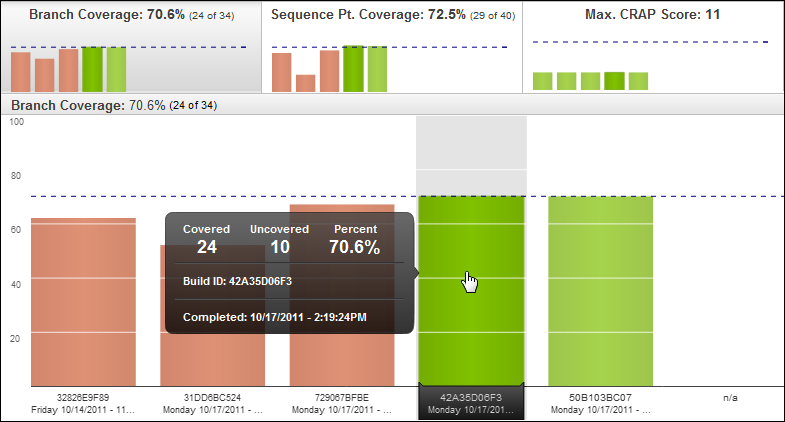
For reports like Branch Coverage, the header displays a percentage of coverage for the selected Execution, with the number of branches that were tested out of the total -- for example, 70.6% (24 of 34).
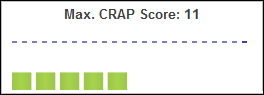
For statistics like Max CRAP Score, the numbers displayed will be quite different; for example, the only relevant statistic for this view is the total CRAP score of 11.
You can click any of the Statistics views to expand the chart and examine it in more detail from the Coverage Data View panel.
You can also minimize the Statistics view at any time by clicking  ,just below the NCover icon.
Coverage Data View
At every level of the Coverage Data View, relevant data points are available when mousing over each bar chart:
Covered - How many of the selected metric, for example, branch points, were covered (that is, tested) in the selected execution.
Uncovered - How many of the selected metric (for example, branch points) were not tested in the selected execution.
Percent - A percentage based on the Covered/Uncovered numbers or the Ratio of coverage (for Satisfactory Complexity).
Build ID - An identifier unique to the project assigned by NCover during profiling.
Completed - A timestamp to indicate when the selected execution finished.
Note that at the Module level  and below on the hierarchy, clicking on a bar causes its corresponding segment in the Statistics view to darken for emphasis.
Filtering Data
NCover offers ways to refine your data collection both before and after coverage is collected.
Pre-Coverage Filter
The Pre-Coverage Filter has two functions:
To exclude code you don't want to be factored into your coverage data.
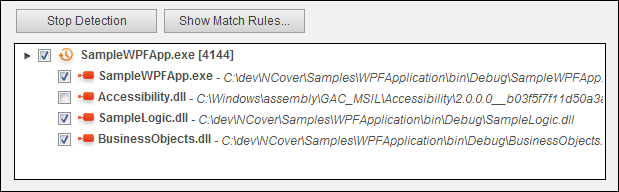
To add modules that weren't pre-populated using Auto-Detect.

Pre-Coverage has four configurable parameters:
- Include or Exclude
- Type - Module, Namespace, Class, Method, Attribute, Document Path, Branch Coverage, Sequence Point Coverage, Max Complexity Percentage and Max Complexity.
- Condition: Matches, Starts With, Ends With, Contains, and Regex.
- Value
Note: When using Create Configuration, you might choose to delete some of the Includes that are automatically created, for example, any testing DLLs or Microsoft constructor classes.
Post-Coverage Filters
Filtering is available for every data view of NCover below the Home page and is applied by creating Filter Rules.
- At any level below Home, click

- Click

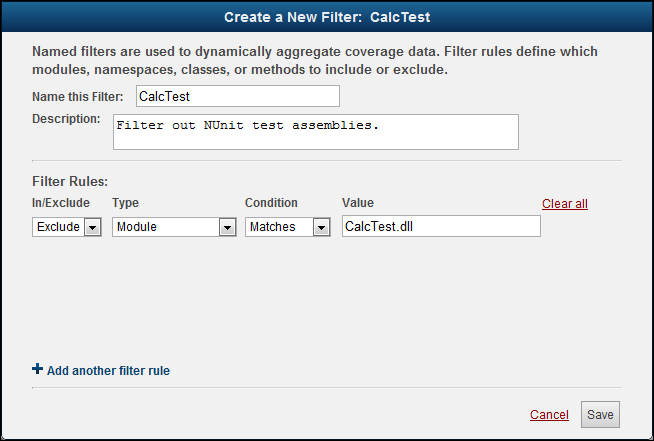
- Create a Name and a Description (the latter is optional).
Filter Rules
Like the Pre-Coverage Filter, Filter Rules have four configurable parameters:
- Include or Exclude
- Type - Module, Namespace, Class, Method, Attribute, Document Path, Branch Coverage, Sequence Point Coverage, Max Complexity Percentage and Max Complexity.
- Condition: Matches, Starts With, Ends With, Contains, and Regex.
- Value
Click the Funnel icon at any level of the data view to apply the rules you've defined in the steps above.
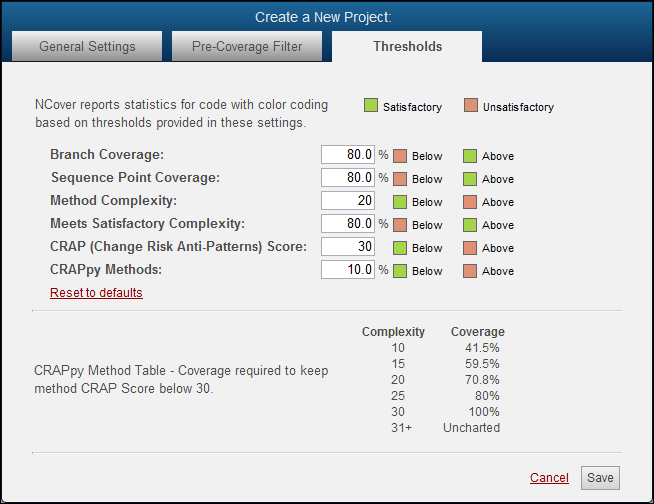
Thresholds
The values you consider acceptable for various coverage metrics are another important kind of filter.
NCover Desktop reports coverage statistics with color coding based on the thresholds provided in these settings, which are set with some reasonable default values when you create a project. You can reset these values at any time from the Project Home view by by clicking  and then clicking Reset to defaults on the thresholds tab.
Merging Executions
Once your coverage data starts to accumulate, you may find it useful to combine data sets by merging them for easier viewing. By clicking the check-boxes to the left of each completed coverage Execution in the Project View, you can select multiple coverage files to merge by clicking the Merge button.
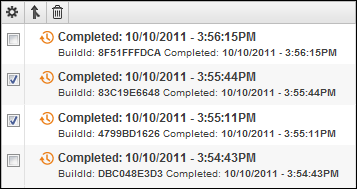
After a merge, the files will be collapsed in the view and identified with the Merge icon. You can still view the executions individually by expanding the tree view of the merged file.
You can rename any execution by clicking on the title and selecting the edit icon. View the coverage logs (if any), by clicking on an execution and then clicking the log icon to display.
 NCover tags all merges beind the scenes. To view your merged executions, just type "merge" in the Search executions field -- NCover will find and display the combined coverage files in the Coverage Navigator.
Project Settings and Options
You can check the Projects Overview of the Home page for high-level data about your coverage:
Total Projects - All projects.
Now Collecting - Projects where coverage is actively being collected.
Now Monitoring - How many projects are Enabled.
After your project is created, you can start or stop coverage collection by individual project using the Enabled/Disabled slider to the left of the project name in the Home view.
Project Logging options are set on the General Settings tab of the Edit Project dialog, using the "Logging Level" drop-down box.
NCover 3 to NCover 4 File Compatibility
Importing Coverage Data
You can import your NCover 3 coverage data file for viewing in NCover 4 using a command line utility included in your NCover 4 install.
This functionality is for individual coverage files only; importing project and trend files is not supported.
Open a Windows Command Prompt and enter "ncover import" to see the coverage file export usage and syntax.
Syntax - NCover Import [<file.nccov>] <project name>
Project name - The NCover 4 project to import from.
File.nccov - The name and path of the XML coverage file.
Default Behavior
Coverage file name -- Required. If you do not specify a coverage file name, NCover import will return an error.
Project name -- Optional. If you do not specify a project name, NCover import will create one based on the coverage file name.
Exporting Coverage Data
You can also export your coverage data file for viewing in NCover 3 using the included command line utility.
This functionality is for individual coverage files only; exporting project and trend files is not supported.
Open a Windows Command Prompt and enter "ncover export" to see the coverage file export usage and syntax.
Syntax - NCover.exe export --project="My Project" --execution="6/22/2012" --file="Unit Test Coverage" --format=json
Project name - * Required * The NCover 4 project to export from.
Execution - Specify execution by Caption, Build Id, or Date.
File - The name and output path of the coverage file.
Format - Export coverage file as 'json' or 'v3xml'.
Include Source - Include source documents.
Default Behavior
Project name -- Required. If you do not specify a project name parameter, NCover export will return an error.
Execution match parameter -- If you do not specify a match parameter, NCover will export the last completed execution.
Output coverage file name -- If you do not specify a file name, NCover will use the project name and the current execution of the project specified in the project name parameter.
NCover Program Data
NCover saves project data and error logs in different locations, depending on your operating system.
Location of NCover program data by platform:
Vista, Windows 7, Windows Server 2008:
NCover Project Data: %ProgramData%\NCoverProjects NCover Error Logs: %ProgramData%\NCoverErrorReports
Windows XP, Windows Server 2003:
Common Application Data: %ALLUSERSPROFILE%\Application Data\NCoverProjects NCover Error Logs: %ALLUSERSPROFILE%\Application Data\NCoverErrorReports