Covering an Application/Manual Testing
NCover Desktop runs as a service, so it's already monitoring, ready to cover any .NET code executing on your machine.
This ability to gather data globally is key to understanding how to leverage the power of NCover Desktop. When starting any project the first question you should ask is, What process do I want to cover? If Desktop can find the executable or service that's exercising your code, it can collect coverage data.
Creating a Project
From the Home view of the NCover Desktop, click  to open the "Create a New Project" window.
Match Rules
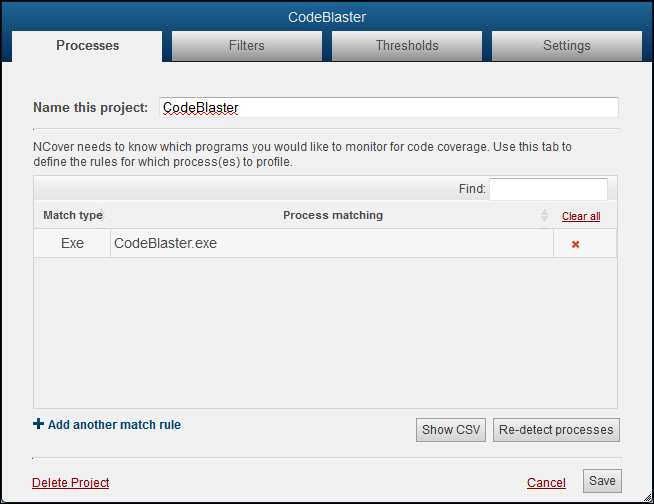
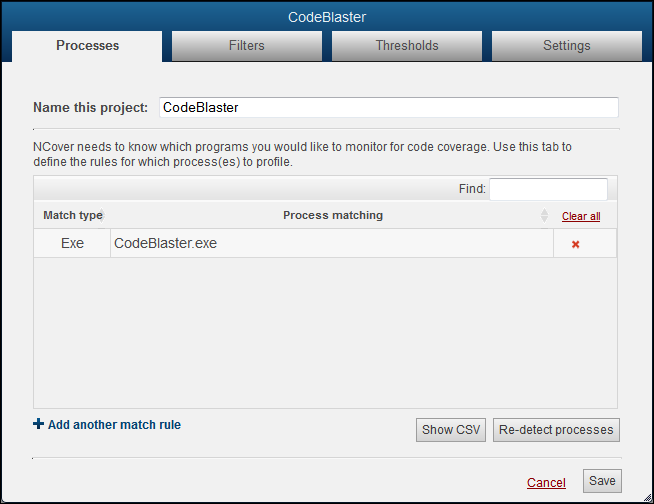
When the "Processes" tab displays, name your project and then select one of two methods to specify the processes to be covered.
Note: If you're setting up coverage for a process running locally on the machine where Code Central is installed, you can let Auto-Configure create project settings for you (see step 3 below).
You can also set up match rules manually, if you prefer.
The two match type options are Regex and Exe.
Let's say you want to monitor the NCover code coverage game, Code Blaster. Regex is a good choice in this case. The Regex option would be simply "CodeBlaster", or "codeblaster" -- the regex isn't case-sensitive.
The Exe option tells the NCover profiler to match on the executable name.
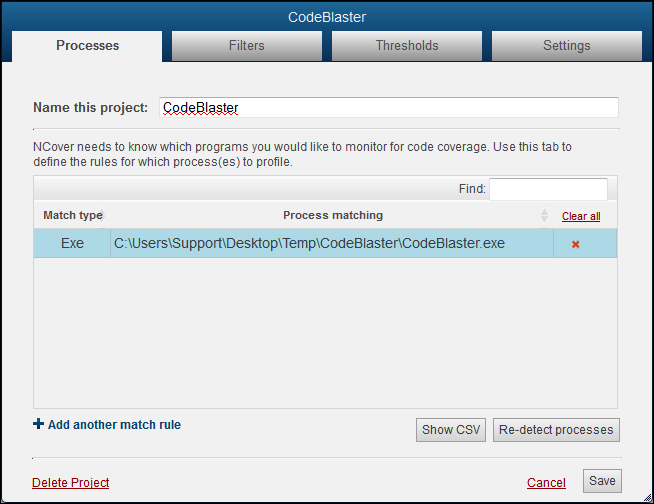
You can also use a file path if you want to profile a process only when it runs from a specific location.
Auto-Configure
You can click on the Auto-Configure button and let NCover create project settings for you.
The Processes tab will switch to the Auto-Detection view and start monitoring for .NET processes as soon as you click on Auto-Configure.
Start the CodeBlaster application, and the executables and assemblies that are being loaded will display in the detection window.
Note: If the process you want to profile is already running, you must re-start it in order for NCover to detect it.
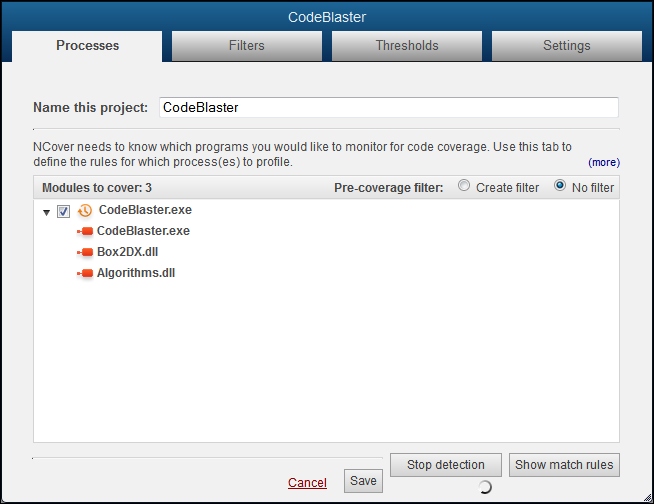
Note: All modules are automatically included when the default "No filter" option is selected.
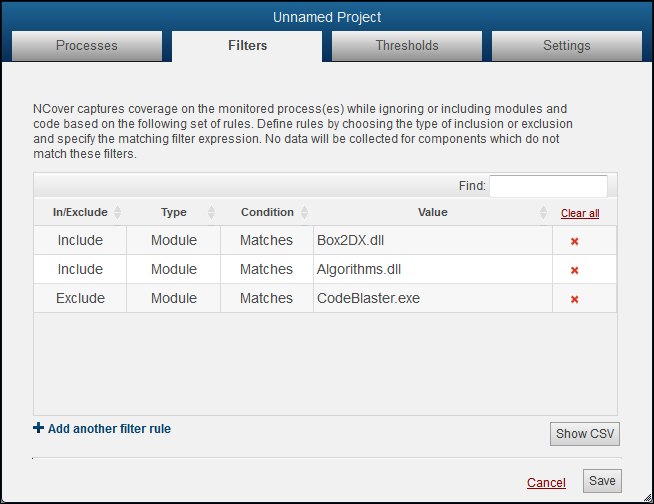
Switch the Pre-Coverage filter radio button to "Create filter" to review the "Modules to cover" and decide whether to include or exclude modules from the list.
Click the checkbox beside each module once to mark with an X to exclude the module. Click twice to mark with a check to include the module.
Note: You can specifically exclude modules by placing an X beside them on this screen, but any modules that are not specifically included will not be profiled, anyway. In other words, not creating an include is functionally the same as creating an exclude rule.
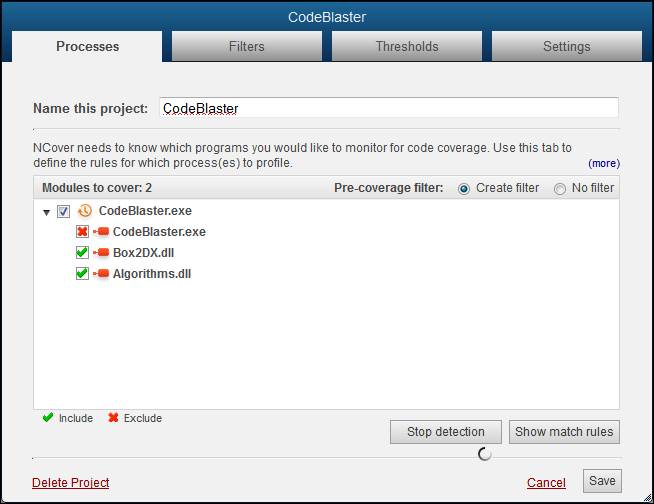
The selections shown above create the filter rules seen below when you click on the Filters tab.
Go the "Processes" tab and click Save to accept these selections, or Re-detect processes to start over.
Collecting Coverage
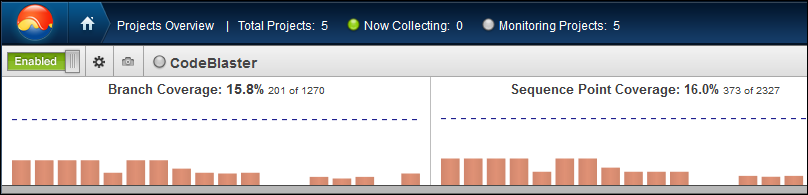
When your project selections are complete, re-start your application and run your manual tests. Go to the Home page and you'll see that the light beside your enabled project is pulsing green to indicate coverage is being collected.

Immediately to the right of your project name, the Modules Collecting counter displays the number of modules being profiled in the current execution of your project. The number will fluctuate while coverage is running, but the counter should eventually disappear when profiling is complete.
When testing is complete, close your tested application and NCover will automatically start compiling the coverage data.
Now that you have coverage data, what does the data mean?